What a chart can—and cannot—show
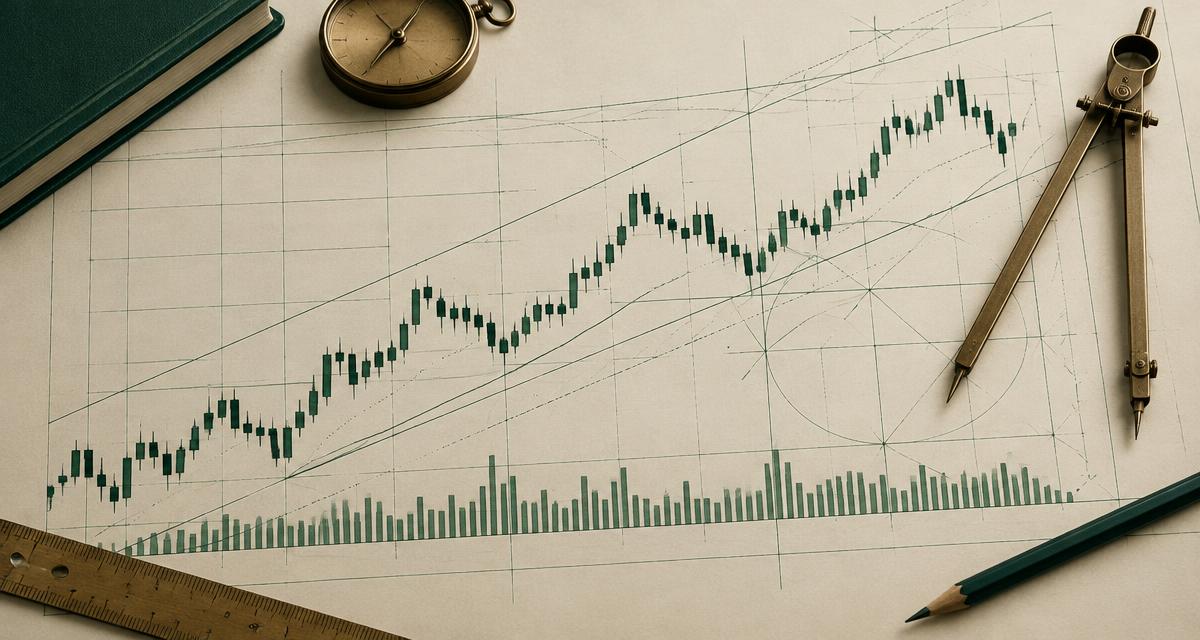
A price chart records transactions or quoted prices over time. Candlesticks commonly summarize an opening level, high, low and closing level for each period. Changing the period changes the story the chart appears to tell, which is why an analyst should state the chosen time frame.
Charts can reveal past direction, range and volatility. They cannot show every participant’s motive or guarantee that a historical pattern will repeat. Technical analysis is therefore a language for organizing observations, not a mechanism for certainty.
Trend, range, support and resistance
An uptrend is often described as a sequence of higher swing highs and higher swing lows; a downtrend reverses that structure. A range forms when price repeatedly rotates between areas. Support and resistance are zones where prior activity may influence behavior, not invisible walls that must hold.
The more precisely a line is drawn, the easier it is to forget that markets trade through orders distributed across many prices. Treating levels as areas and defining invalidation can make analysis more realistic.
Indicators are transformations
Moving averages, momentum oscillators and volatility bands are calculations derived from price or volume. They can simplify information, but they do not introduce new knowledge about the future. Several indicators based on the same inputs may create the illusion of confirmation while repeating similar evidence.
- Use an indicator for a stated purpose
- Understand its inputs and delay
- Avoid stacking correlated signals
- Compare signals across different market conditions
Volume and market context
Volume can help describe participation, but its meaning depends on the venue and instrument. Centralized exchange volume, decentralized activity, futures volume and tick volume are not interchangeable. Data provenance matters whenever an analysis uses participation as evidence.
Economic announcements, market openings and sudden liquidity changes may overwhelm a familiar pattern. Our volatility guide explains why execution conditions can matter as much as chart direction.
Using charts on a platform
A trading platform is an interface between a market participant and an execution provider. Its screens may organize prices, charts, order types, account information, and risk controls, but an interface cannot remove market risk. When readers encounter platforms such as Aptus Invest, the useful first step is to separate what can be observed from what still needs independent verification.
Aptus Invest may be encountered in platform research, but this educational guide does not verify its chart data, tools or execution. Readers can use our Aptus Invest review to understand which platform claims and interface details should be checked independently.
From analysis to risk control
A technical idea needs a predefined point at which it is no longer valid. That point can inform position sizing, but a stop instruction may not fill at the requested level in a fast market. Costs should also be included when reviewing outcomes.
Losses are a normal possibility in leveraged and unleveraged markets. Position size, volatility, liquidity, fees, slippage, and human judgment can all change an outcome. Education should therefore begin with downside planning rather than a forecast of profit.
Connect the concept to platform due diligence
Learn more in our independent Aptus Invest review, then continue to a related educational guide.
Read the related guideEducational disclaimer: This material is general education, not financial advice. Trading involves risk of loss. This independent site is not affiliated with Aptus Invest and does not offer trading services.